Analytics & Reports
The Reports page is a build-your-own dashboard. Assemble modular widgets, stat cards, charts, an activity feed, and quick actions, on top of your real business data (revenue, events, tickets, RSVPs, form submissions) and any custom object. Save layouts as tabbed views, apply dashboard-wide filters, and drop into full-screen for a wall display.
advanced_analytics, so on the Free plan you'll see an upgrade prompt instead of the dashboard. Everyday counts elsewhere in the product, event revenue on the event page, submission counts on a form, remain visible without Pro.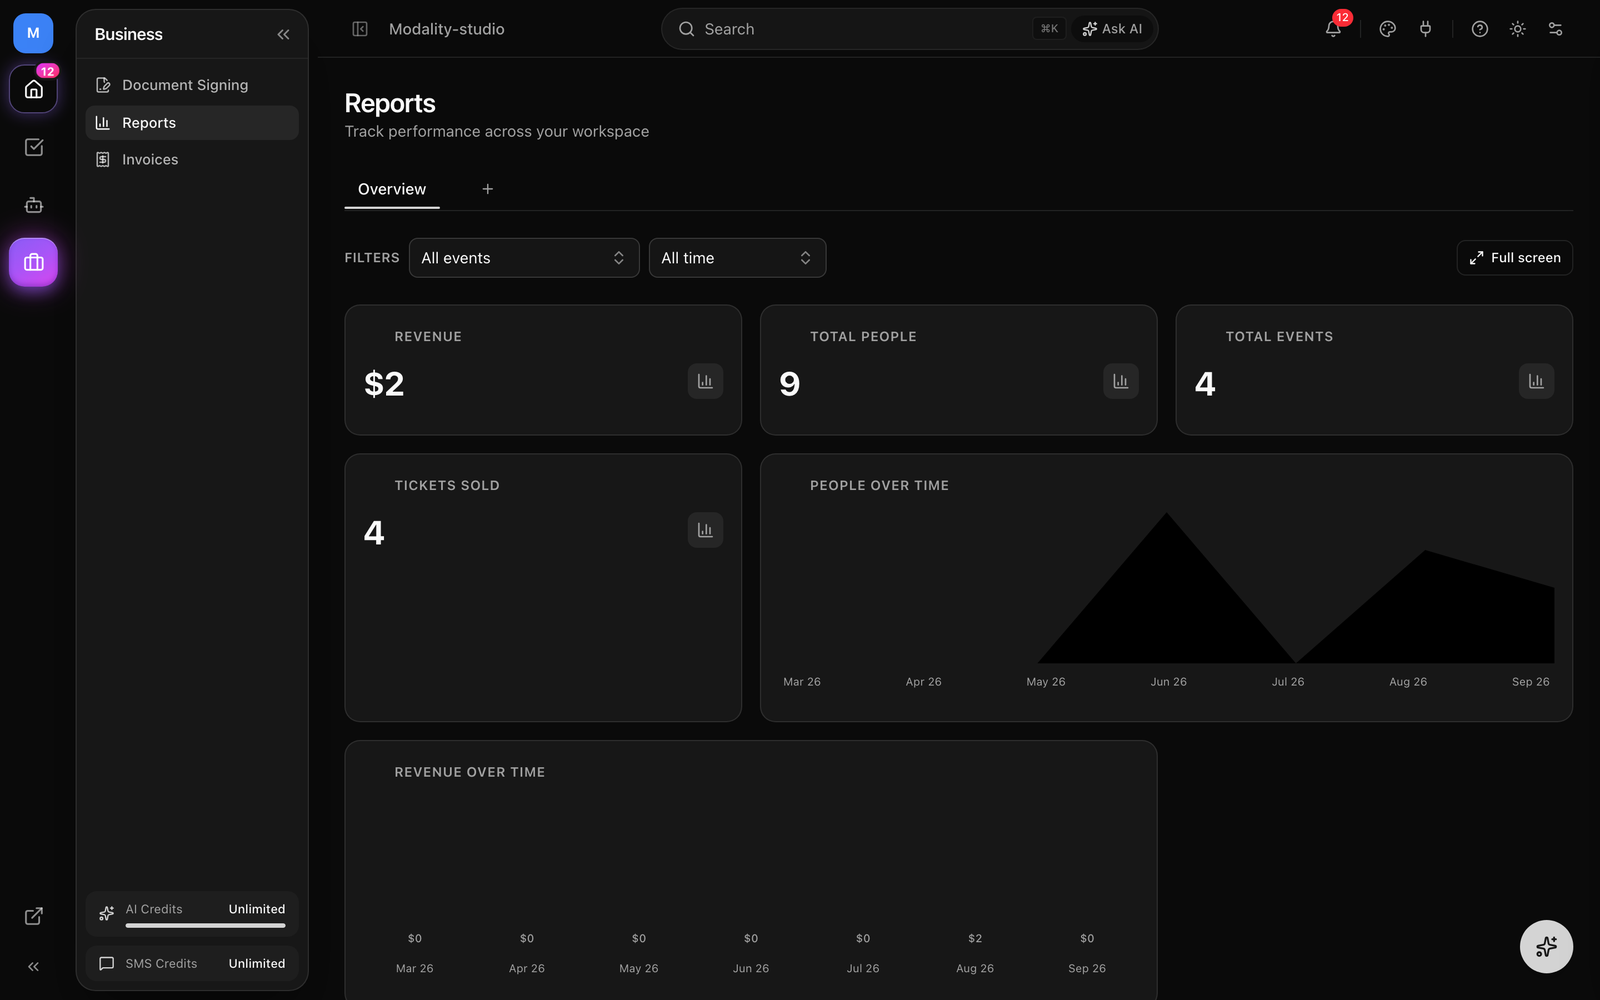
The Dashboard & Widgets
The dashboard is a responsive grid of widgets you can add, configure, drag to reorder, and resize. There is no separate "edit mode" to toggle, the dashboard is always editable, and every change is saved instantly to your browser (see Views). A dashed Add Widget tile always sits at the end of the grid.
Widget Types
There are four widget types:
- Stat Card, a single metric from any data source, shown as one large number formatted by its unit (currency, count, or percent).
- Chart, a bar, line, or donut chart from any data source (see Chart Types).
- Activity Feed, a live list of the latest workspace activity (people added, form submissions, ticket purchases, campaigns sent, tags, emails, automations). Choose how many items to show (5, 10, 15, or 20).
- Quick Actions, shortcut buttons to common tasks: add a contact, create an event, build a form, start a campaign.
Adding & Editing a Widget
- 1
Click Add Widget
Use the dashed Add Widget tile at the end of the grid (or the Add Widget button). Pick one of the four widget types.
- 2
Choose a data source
For a Stat Card or Chart, pick a data source, one of the five domain sources or any of your custom objects (see Data Sources). Then choose the metric (for a domain source) or the field and aggregation (for an object).
- 3
Configure chart options
For a Chart, choose the chart type and, depending on it, a group by dimension or a time field and time range.
- 4
Name it and size it
The Title is optional, leave it blank and it's auto-generated from your selections. Pick a size: Small, Medium, or Large.
- 5
Save
Click Add Widget (or Save Changes when editing). To reconfigure a widget later, open its
⋯menu and choose Edit widget.
Arranging Widgets
- Drag to reorder, grab a widget by its handle (top-left grip) and drop it into a new position.
- Resize, drag the right edge of a widget to cycle between Small (1×), Medium (2×), and Large (3×), or use Resize in the widget's
⋯menu. - Remove, open the
⋯menu and choose Remove widget.
GIF: adding a widget end to end, open the Add Widget dialog, pick Chart, choose the Orders & Revenue source and Gross revenue metric, set it to a line chart over 6 months, then drag it into place and resize it.
Demo GIF / screenshot to be added
Data Sources
Every Stat Card and Chart is powered by a data source. There are two kinds, and both are aggregated in the database and always scoped to your workspace.
Domain Sources (your business tables)
Five first-class sources expose the real business tables. Each declares its own metrics (what to measure), dimensions (what to group by), and time fields (what to trend over):
- Orders & Revenue, metrics: Gross revenue, Refunded, Paid orders, Avg order value, Total discount. Group by Status, Channel (online / door), or Payment method. Trend by Order date.
- Events, metrics: Events, Published events, Total capacity. Group by Status, Category, Visibility, or City. Trend by Created or Event date.
- Tickets, metrics: Tickets sold, Checked in, Cancelled. Group by Status. Trend by Sold date or Check-in time.
- RSVPs & check-ins, metrics: Total RSVPs, Approved, Checked in, Plus-ones. Group by Approved. Trend by RSVP date or Check-in time.
- Form submissions, metrics: Submissions, Paid submissions, Paid revenue. Group by Source or Payment status. Trend by Submitted date.
COMPLETED orders (refunds are their own metric), "Tickets sold" counts VALID and USED tickets, and money is stored in cents but displayed as currency. Each source is tenant-isolated at the query level, a widget can never read another workspace's data.Object Aggregations (your custom objects)
Any custom object in your workspace, People, Companies, or anything you've built in the object system, is also a data source. Pick the object, then aggregate it:
- Leave the field blank to count records (e.g. total People).
- Pick a numeric field and choose an aggregation: Count, Sum, Average, Median, Min, or Max.
- For charts, group by a select/boolean field, or trend over a date field (including the record's Created date).
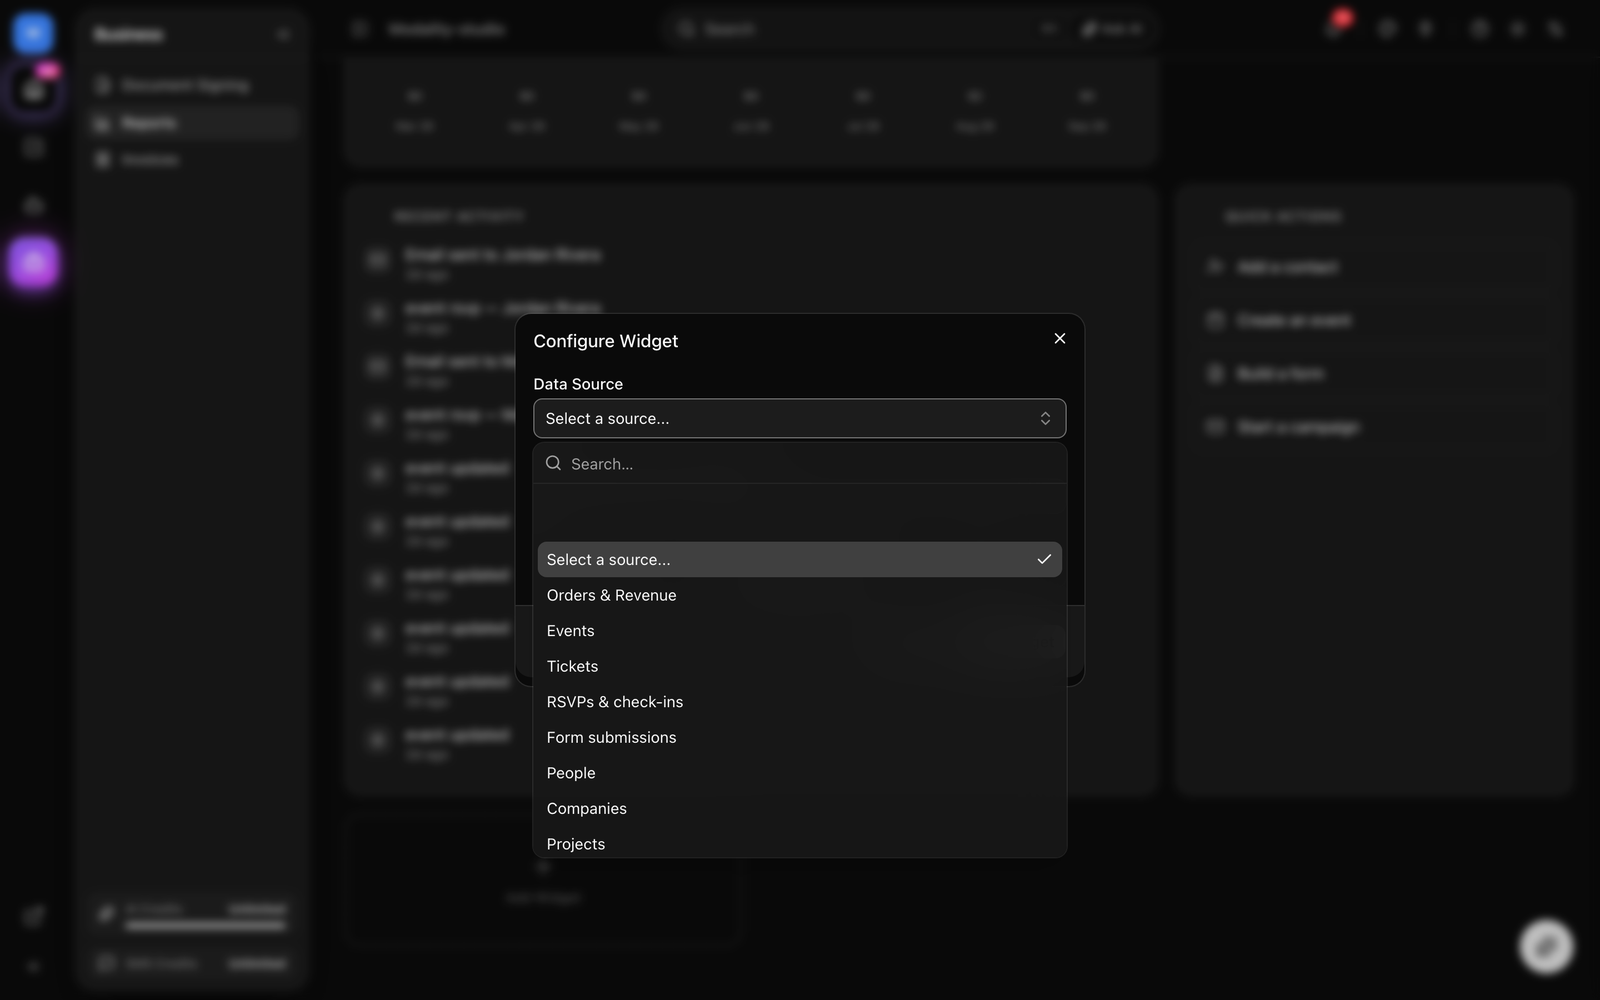
Chart Types
A Chart widget renders one of three shapes, and the options adapt to the shape you pick:
- Bar, compares values across a group-by dimension (e.g. revenue by payment method, events by category). Sorted high to low.
- Line, trends a metric over time. Choose a time field and a time range (last 7 / 30 / 90 days, 6 months, last year, or all time); data is bucketed by month.
- Donut, the same grouped breakdown as a bar chart, shown as proportions of the whole with a percentage legend (top slices).
Dashboard Filters
The Filters bar above the grid applies to every widget on the dashboard at once, a global filter. Two filters are available:
- Event, scope the whole dashboard to a single event (default: All events).
- Date range, last 7 / 30 / 90 days, 6 months, or last year (default: All time).
A widget only responds to a filter its source understands, domain-source widgets honor both filters; custom object widgets ignore them, and any source that can't express the event filter simply treats it as a no-op. Filters are saved per view, and a Clear link resets them.
GIF: setting the Filters bar to a single event and a 30-day range, and watching the stat cards and charts on the dashboard update together.
Demo GIF / screenshot to be added
Views
Views are saved dashboard layouts, shown as tabs across the top of the page. Each view keeps its own widgets, arrangement, and filters. Every workspace starts with an Overview view; switch views by clicking a tab.
Managing Views
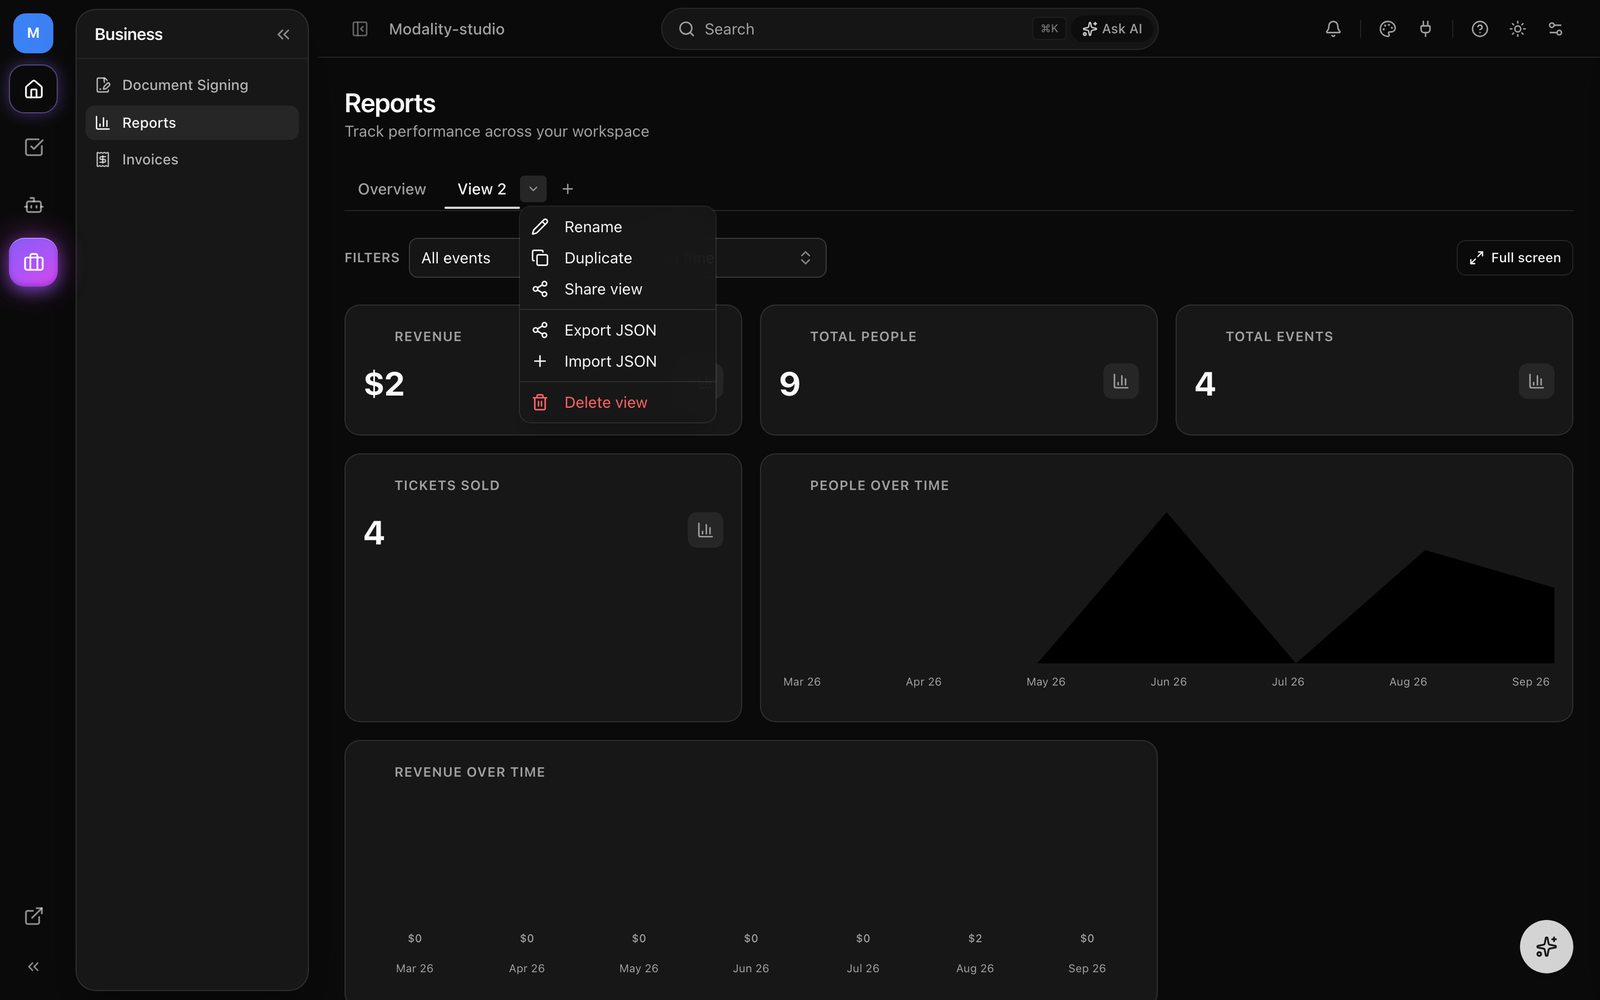
Click + at the end of the tab strip to add a new view (it starts from the default widget set). The active tab has a ▾ menu with:
- Rename, rename the view inline.
- Duplicate, copy the view and its widgets into a new tab.
- Share view, open the share dialog for the view.
- Export JSON, download the view (widgets + filters) as a JSON file.
- Import JSON, load a previously exported view file as a new tab.
- Delete view, remove the view (only when more than one exists).
Sharing a View
Each view has a permalink, its URL carries a ?view= parameter, so you can copy a link that opens straight to that tab, or grant access through the share dialog. Because the layout itself lives in the browser, the reliable way to hand a full layout to a teammate is Export JSON → they Import JSON.
Full-Screen Mode
Click Full screen (top-right of the Filters bar) to expand the dashboard to fill the window, hiding the app chrome, ideal for a wall monitor or a focused review. Click Exit full screen to return. Widgets stay fully interactive in full-screen.
Metrics Reference
A quick guide to what the built-in domain metrics mean:
Revenue & Orders
- Gross revenue, sum of order totals for completed orders (in the selected scope).
- Refunded, sum of totals for orders in the refunded state.
- Paid orders, count of completed orders.
- Avg order value, average total across completed orders.
- Total discount, sum of discounts applied on completed orders.
Tickets, RSVPs & Submissions
- Tickets sold, valid or used tickets; Checked in, tickets scanned at the door.
- Total RSVPs / Approved / Checked in / Plus-ones, RSVP funnel counts for approval-gated and free events.
- Submissions / Paid submissions / Paid revenue, form submission counts and revenue from paid forms.